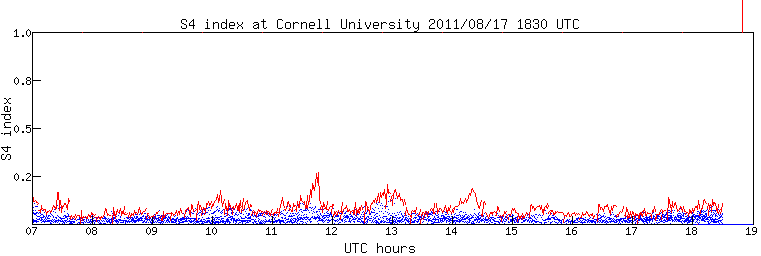

The top plot indicates the recent history of the scintillation index (S4 index) at Cornell University. (Geomagnetic Position: 53.24 deg. latitude, 359.52 deg. longitude) The S4 index is a metric for indicating the amount of variation in the amplitude of a signal. In this situation the S4 index is an indicator of the standard deviation of the GPS satellites' received signal power as seen on the ground.
The bottom plot is an elevation/azimuth plot of the GPS satellites currently in view. The size of the circle, denoting the location of each satellite, is dependent on the S4 index. the larger the circle the larger the S4 index and vice versa
The main causes of these variations are multipath and ionospheric electron density fluctuations. Filtering techniques can generally eliminate the multipath component leaving only the ionospheric component. This data is generated by the Cascade GPS receiver.