6 December 2006 solar radio burst associated with the X-6 flare at 1845 UT
|
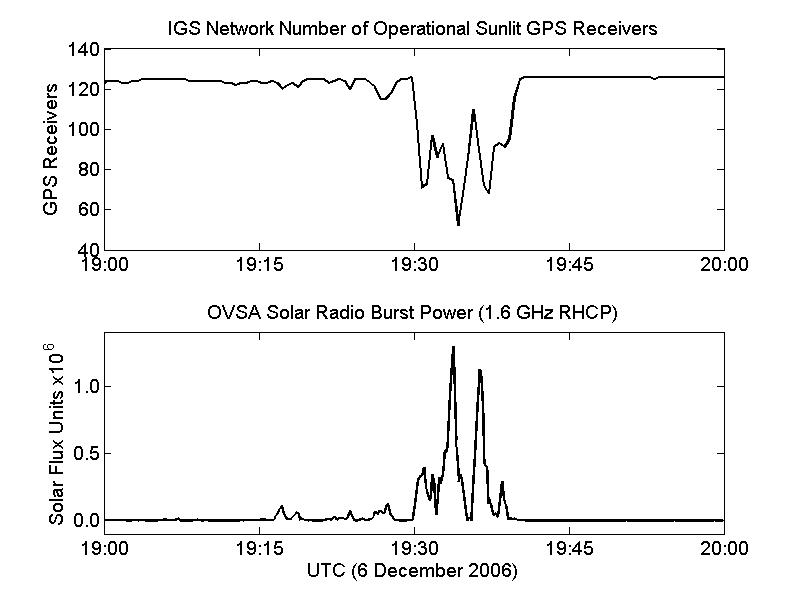
Image depicting the total number of IGS receivers capable of producing a
dual-frequency 4+=-satellite navigation solution on the sunlit hemisphere
of the earth. Note that before and after the solar radio burst, >120 receivers
on the sunlit hemisphere were producing a navigation solution. At the peak
of the solar radio burst, the number of fully operational receivers dropped to less than 60.
|
The following plots demonstrate the effect of the solar radio burst on two Global Positioning System receivers. The solar radio bursts were associated
with the 6 December 2006 X-6 solar flare from active region 10930. There have been widespread reports of GPS, and DGPS
problems concurrent with the solar radio bursts. The magnitude of the fades at L1 and L2 due to the solar radio bursts are unprecedented and have
never been observed before.
|
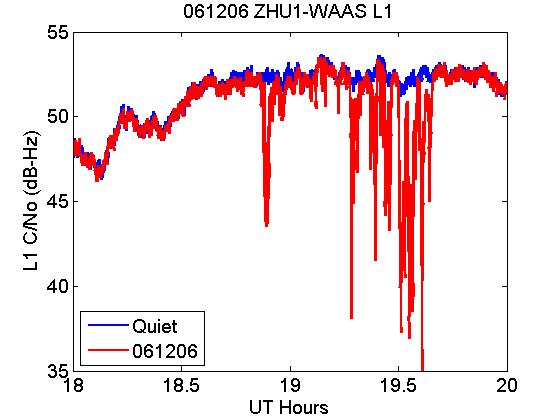
C/No ratio for the day before the event (blue) compared to the day of the event
(6 Dec. 2006) (red) [y-axis is C/No in dB-Hz, x-axis is UTC hours]. The fades had a duration of about 1/2 hour and at L1 was observed
to have a peak fade of >17 dB. The data is from the ZHU1 (Houston, TX) FAA WAAS receiver, PRN 4. The sampling rate is 1 Hz. The fades caused the receiver to lose L1 and L2 signal lock on a low-elevation satellite.
|
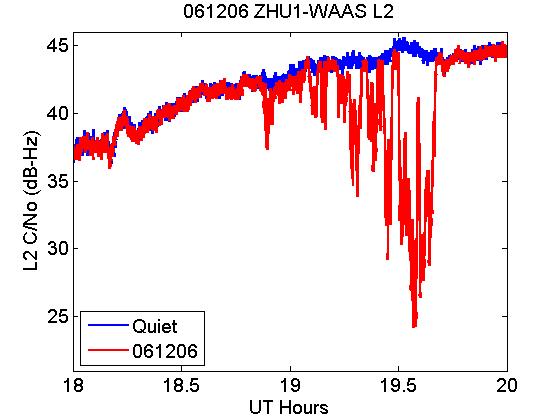
C/No ratio for the day before the event (blue) compared to the day of the event (6 Dec. 2006) (red) [y-axis is C/No in dB-Hz, x-axis is UTC hours].
In this plot the L2 frequency is shown. The peak fade was about 20 dB. The data is also from the ZHU1 FAA WAAS
receiver, PRN 4. The sampling rate is 1 Hz.
|
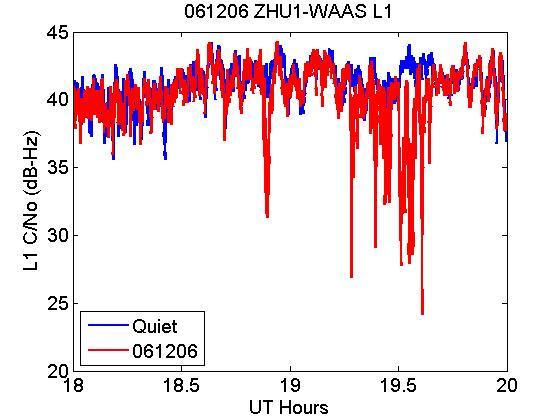
C/No ratio for the day before the event (blue) compared to the day of the event (6 Dec. 2006) (red) [y-axis is C/No in dB-Hz, x-axis is UTC hours].
In this plot the L1 frequency is shown. The data is also from the ZHU1 FAA WAAS receiver, but is shown for PRN 20, a low elevation (low signal power) satellite.
Note that the signal power fell well below the 30 dB-Hz threshold commonly associated for a visible satellite.
|
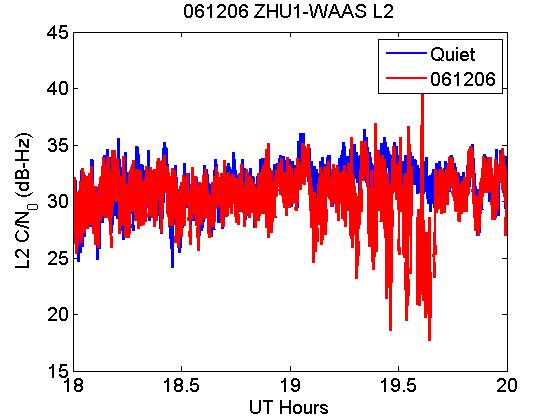
C/No ratio for the day before the event (blue) compared to the day of the event (6 Dec. 2006) (red) [y-axis is C/No in dB-Hz, x-axis is UTC hours].
In this plot the L2 frequency is shown. The data is also from the ZHU1 FAA WAAS
receiver, PRN 20.
|
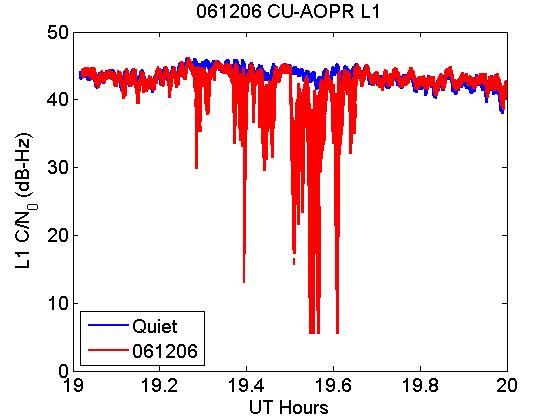
C/No ratio for the day before the event (blue) compared to the day of the event (6 Dec. 2006) (red) [y-axis is C/No in dB-Hz, x-axis is UTC hours].
These are high data-rate receivers providing C/No at 50 Hz. The fades caused this particular receiver to lose lock at several points during the solar radio burst (the receiver is not capable of tracking below ~30 dB-Hz) .
The receiver is an L1-only Cornell ScintMon receiver located at Arecibo Observatory, Puerto Rico.
|
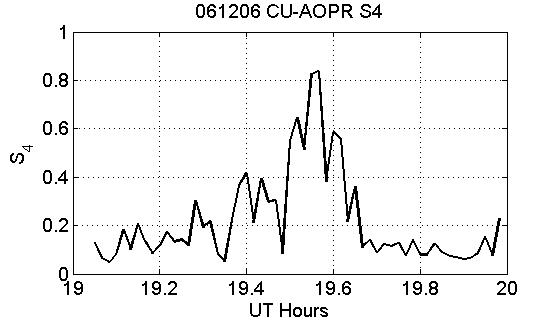
S4 index as calculated every UTC minute over 1 minute intervals on the 50 Hz data recorded from Arecibo on PRN 17 (same data as shown in previous plot).
The S4 index is quite high indicating the rapid variations of the signal power caused by the solar radio burst. The S4 index is NOT high because of ionospheric irregularities causing diffraction/refraction of the GPS signal. |
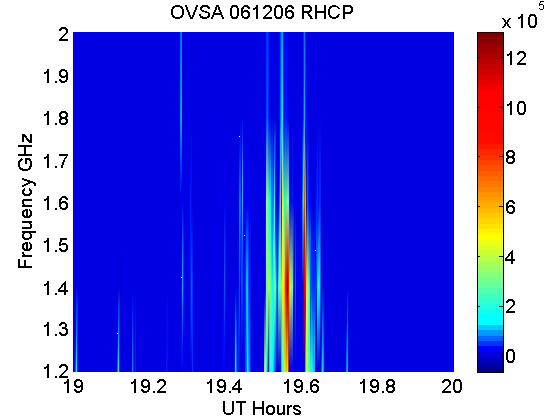
The data in the previous image was taken from the Owens Valley Solar Array operated by the New Jersey Institute of Technology (data courtesy of Dr. Dale Gary).
The image shows the power in solar flux units (1 SFU = 10^(-22) W/m^2-Hz) right-hand circularly-polarized mode from 1.2-2 GHz (RHCP is the mode that will affect most GPS systems
since they use RHCP antennas). The time is in UT hours. Note that
the peak flux exceeded 1 million SFU--a record for these frequencies. GPS L1 is at 1.57542 GHz and GPS L2 is at 1.2276 GHz.
|
13 December 2006 solar radio burst associated with the X-3 flare at 0240 UT
|
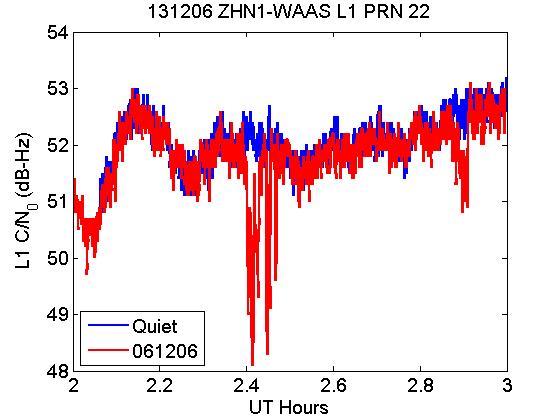
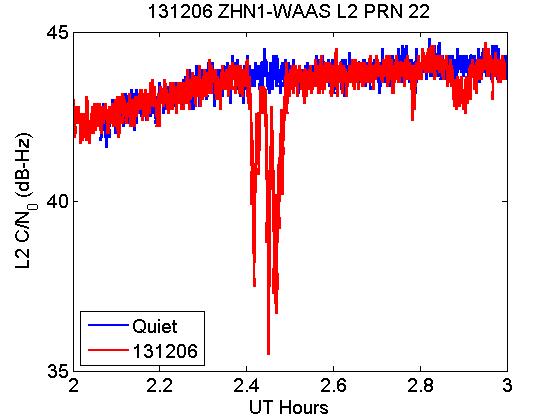
The data in the next two images was taken from the ZHU1 WAAS receiver in Honolulu Hawaii. The data shown are for the 13 December 2006 solar radio burst associated with the X-3 flare from AR 10930 at 0240 UT.
The solar radio burst exceeded 150,000 SFU total polarization as measured at Palehua RSTN. Both plots are 1 Hz data for PRN 22.
|
14 December 2006 solar radio burst associated with the X-1 flare at 2215 UT
|
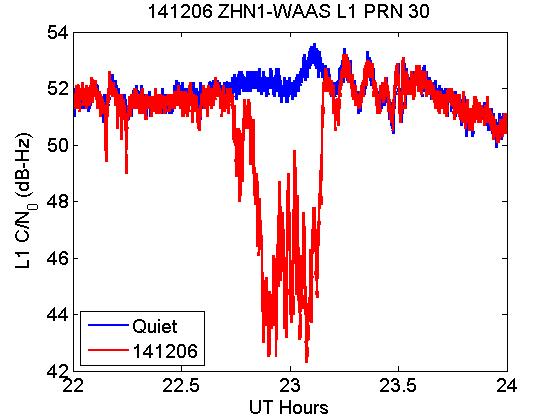
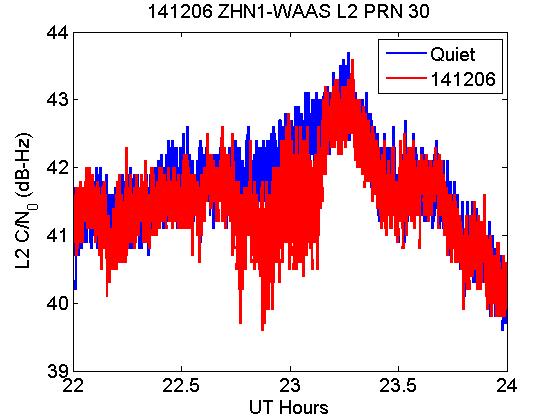
The data in the next two images was taken from the ZHU1 WAAS receiver in Honolulu Hawaii. The data shown are for the 14 December 2006 solar radio burst associated with the X-1 flare from AR 10930 at 2215 UT.
Notice that in the L1 figure (top) that the fade from this solar radio burst is quite drastic (the flare exceeded 150,000 SFU), however in the L2 frequency there was hardly any response indicating that
there was little solar radio burst power at GPS L2. Both plots are 1 Hz data for PRN 30.
 The data in the following image shows the solar radio burst power in the RHCP mode from the Owens Valley Solar Array
at 1.2, 1.4, and 1.6 GHz. Clearly the power at 1.6 GHz (~GPS L1) was two orders of magnitude larger than the power
at 1.2 GHz (~GPS L2). The difference in power at the two frequencies clearly illustrates why the L2 signal was not affected
by the solar radio burst, whereas the L1 signal was drastically affected.
The data in the following image shows the solar radio burst power in the RHCP mode from the Owens Valley Solar Array
at 1.2, 1.4, and 1.6 GHz. Clearly the power at 1.6 GHz (~GPS L1) was two orders of magnitude larger than the power
at 1.2 GHz (~GPS L2). The difference in power at the two frequencies clearly illustrates why the L2 signal was not affected
by the solar radio burst, whereas the L1 signal was drastically affected.
|