|
|
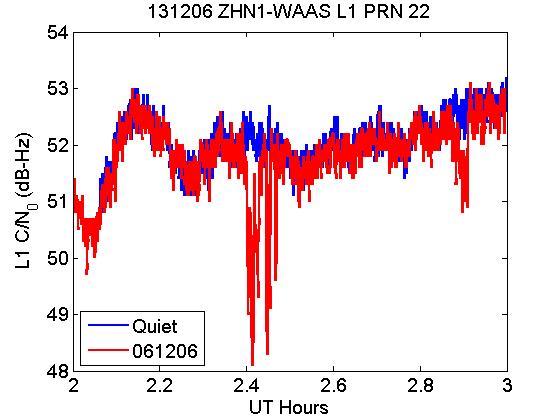
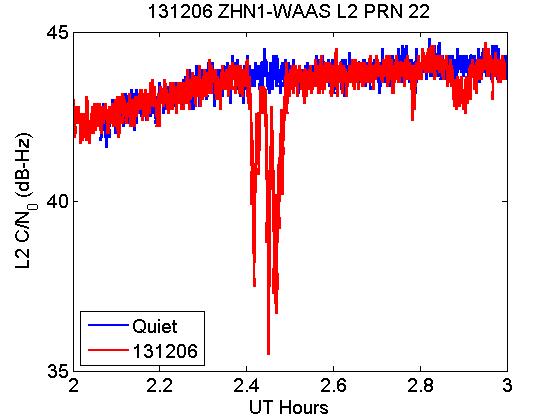
13 December 2006 solar radio burst associated with the X-3 flare at 0240 UT
|
The data in the next two images was taken from the ZHU1 WAAS receiver in Honolulu Hawaii. The data shown are for the 13 December 2006 solar radio burst associated with the X-3 flare from AR 10930 at 0240 UT.
The solar radio burst exceeded 150,000 SFU total polarization as measured at Palehua RSTN. Both plots are 1 Hz data for PRN 22.
|
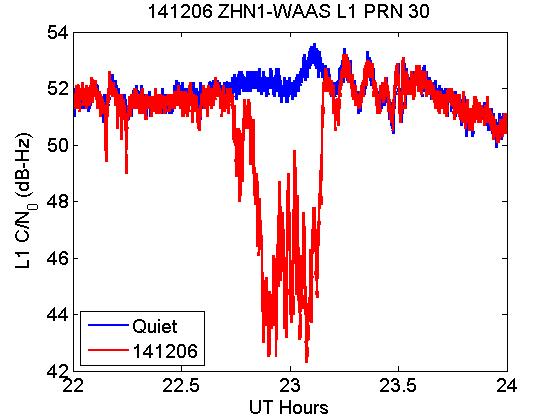
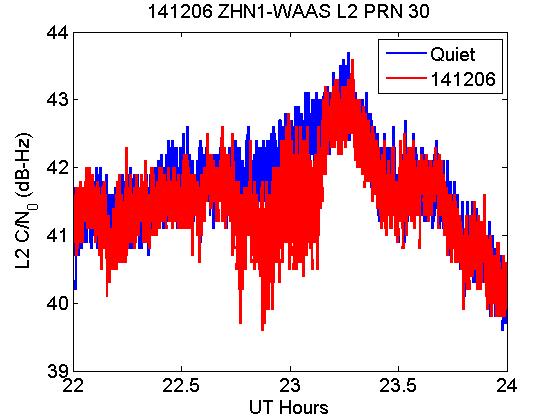
14 December 2006 solar radio burst associated with the X-1 flare at 2215 UT
|
The data in the next two images was taken from the ZHU1 WAAS receiver in Honolulu Hawaii. The data shown are for the 14 December 2006 solar radio burst associated with the X-1 flare from AR 10930 at 2215 UT.
Notice that in the L1 figure (top) that the fade from this solar radio burst is quite drastic (the flare exceeded 150,000 SFU), however in the L2 frequency there was hardly any response indicating that
there was little solar radio burst power at GPS L2. Both plots are 1 Hz data for PRN 30.
 The data in the following image shows the solar radio burst power in the RHCP mode from the Owens Valley Solar Array
at 1.2, 1.4, and 1.6 GHz. Clearly the power at 1.6 GHz (~GPS L1) was two orders of magnitude larger than the power
at 1.2 GHz (~GPS L2). The difference in power at the two frequencies clearly illustrates why the L2 signal was not affected
by the solar radio burst, whereas the L1 signal was drastically affected.
The data in the following image shows the solar radio burst power in the RHCP mode from the Owens Valley Solar Array
at 1.2, 1.4, and 1.6 GHz. Clearly the power at 1.6 GHz (~GPS L1) was two orders of magnitude larger than the power
at 1.2 GHz (~GPS L2). The difference in power at the two frequencies clearly illustrates why the L2 signal was not affected
by the solar radio burst, whereas the L1 signal was drastically affected.
|
|